Image: Calorific
Calories: even if you’ve never had to count them before, you probably know what they are.
Essentially, they’re the units of energy contained in everything we eat and drink, in varying amounts. The more of these units you consume, the more physical activity you need to do in order to use them up and maintain your weight, or reduce it. That’s why so many eating regimens are guided by daily calorie intakes; for instance, women aiming to lose weight will generally aim to eat around 1200 calories per day.
News you probably don’t want to hear about raw cookie dough.
But while we’re all familiar with the idea of calories, knowing what they look like on your plate is less straightforward. Obviously, a 200-calorie serving of spinach looks very different to 200 calories worth of mud cake – and now there’s an app that illustrates exactly how big (read: heartbreaking) that difference is.
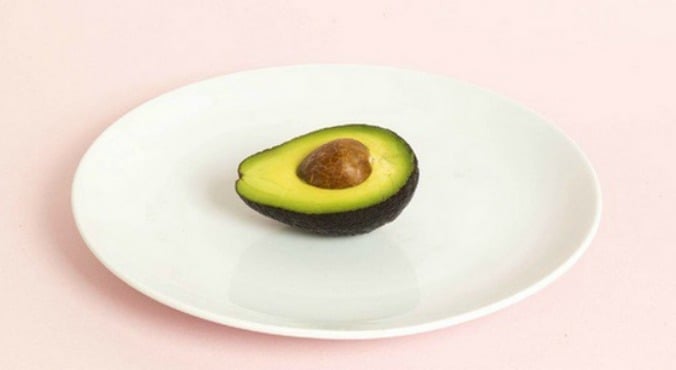
The Calorific app has been developed to make the art of calorie calculation a whole lot easier, by showing users what a 200 calorie serve of their favourite foods looks like. In some cases, the results are pleasantly surprising. For example, 200 calories translates to 1.5 bananas, 350 grams of blueberries or a glass and a half of semi-skimmed milk.
That doesn’t sound too bad, right?
However, the truth hurts a little bit more when you get to the baked goods and confectionery. We're talking a 252 gram slither of apple pie, half a blueberry muffin or precisely 71 grams of pancake.


